DrFuel Engineering · Technical reference
Fuel Pump Relays, SSRs & PDMs: PWM Engineering for Motorsport Fuel Delivery
Understand fuel pump relays, solid-state relays (SSRs), PDMs and PWM fuel-pump control: motor physics, switching heat, flyback protection, calibration and the AI.SSR25.
- Author
- Aftermarket Industries Engineering
- Published
- Reading time
- 15 min read
1. Relay, SSR or PDM?
We use pulse-width modulation (PWM) to control high-output motorsport fuel delivery and fuel-system heat generation. Modulating the duty cycle of suitable in-tank turbine fuel pumps—such as Walbro 460, 525 and 535 models or the Bosch BR540—can reduce current draw, fuel recirculation and low-load heat generation.
Duty cycle and frequency describe different things. Duty cycle is the proportion of each cycle for which the power switch is on; frequency is the number of cycles per second. At 500 Hz, each cycle lasts 2 ms. An 80% power-switch duty cycle gives 1.6 ms on and 0.4 ms off. Motor current can continue through the freewheel path during the off interval. This is a timing example, not a recommended frequency or minimum duty for every pump.
A conventional fuel pump relay provides on/off switching. A suitably specified solid-state relay (SSR) uses semiconductor switching and can support PWM without mechanical contacts. A power distribution module (PDM) generally controls and protects multiple electrical circuits; PWM capability, channel limits and inductive-load suitability depend on the specific PDM. A single AI.SSR25 relay is not a complete multi-channel PDM.
Misunderstanding motor inductance, carrier frequency or semiconductor switching can lead to noise, excess heating, pump stalling or controller failure. We explain the electrical and hydraulic considerations here and introduce our Aftermarket Industries AI.SSR25.
We use application examples to explain calibration, not to set universal limits for every pump or ECU. Before commissioning, confirm the component datasheets, wiring instructions, fuel-pressure requirements and thermal limits for your installation. Our product specifications must be read with their operating and installation conditions; they are not a substitute for application-specific testing.
2. Motor physics: armature inductance and current ripple
A brushed DC permanent-magnet pump motor can be represented by winding inductance L, winding resistance R and rotational back-EMF. When a solid-state switch chops its supply, winding current cannot change instantaneously.
The inductive voltage law describes current change. Our simplified ripple expression assumes continuous current, an ideal freewheel path and approximately linear current ramps. It is not reliable when long on/off periods allow current to decay to zero or when resistance and back-EMF dominate the waveform. Increasing carrier frequency often reduces ripple, but we verify the actual pump-current waveform rather than extrapolate this approximation outside its assumptions.
Our worked inductance range of 40–80 µH is an illustrative assumption, not a measured or manufacturer-verified value for the Walbro 460, 525 or 535. We cannot use it to prove a minimum PWM frequency for those pumps. At 200 Hz a cycle lasts 5 ms; at 500 Hz it lasts 2 ms. These longer cycles can allow larger current swings than higher-frequency operation, depending on the actual motor and freewheel circuit.
Why low frequency can increase pump heat: winding copper loss depends on RMS motor current, not just average current. At the same average motor current and winding resistance, additional ripple increases I_RMS² × R. The power-stage switching loss may fall at lower frequency while the motor's winding loss rises. A cool relay does not prove that the pump is running efficiently or safely.
Worked illustration—not a Walbro benchmark: a 10 A average motor current with 10 A peak-to-peak triangular ripple has approximately 10.41 A RMS current. Its copper loss is about 8.3% higher than perfectly smooth 10 A DC through the same resistance. We do not assign this ripple or heat increase to a particular pump without measurements. Pump case temperature alone is not winding temperature.
- Variables: V_BAT is battery voltage in volts; D is duty cycle from 0 to 1; L is armature inductance in henries; f_PWM is carrier frequency in hertz; ΔI_pp is peak-to-peak motor-current ripple. R is winding resistance at the relevant operating temperature.
- RMS resistive heating: average DC current alone does not establish winding heat. Ripple affects RMS current, and copper losses increase with its square.
- Brush and commutator loading: torque pulsation and current transitions can increase mechanical and electrical stress. Do not assume a frequency is harmless solely because the motor turns.
- Audible resonance: the pump body or fuel tank can amplify switching-related vibration.
Vₗ(t) = L × di(t)/dtΔI_pp ≈ V_BAT × D × (1 − D) / (L × f_PWM) [ideal continuous-current approximation]T = 1 / f_PWM; τ = L / RCopper loss = I_RMS² × RI_RMS² = I_avg² + I_ripple,RMS²For triangular ripple: I_ripple,RMS² = ΔI_pp² / 123. Carrier frequency: evidence and validation candidates
For Walbro/TI Automotive 460, 525 and 535 pumps, we do not present 200–500 Hz as a preferred default, 1 kHz as a proven minimum, or 10 kHz as a proven ideal. The TI Automotive F90000285 and F90000295 public performance sheets cited below do not specify a minimum or optimum power-PWM frequency. We have no matched, pump-specific thermal benchmark establishing those thresholds. Identify the exact part number rather than relying only on a marketing flow name.
Microchip's AN905 gives 4–20 kHz as a general brushed-DC motor rule of thumb and recommends experimenting with frequency. This supports evaluating a higher-frequency candidate such as 10 kHz when the pump, controller and ECU allow it; it does not establish a Walbro-approved setting. We treat 1 kHz as an intermediate test point and 10–20 kHz as a candidate range to validate, not as guaranteed pass/fail limits.
Our practical selection process is to check the component limits, then compare current ripple, peak/RMS current, delivered flow, pressure, system power, temperatures and noise at matched hydraulic operating points. Choose the setting that meets the required performance and safety margins; do not select it from a controller-only watt estimate. If the ECU cannot command a suitable validated frequency, use a compatible output/controller arrangement rather than assume the ECU's available range is harmless.
Do not confuse an ECU command frequency with the motor power-carrier frequency. An intelligent pump module may accept a low-frequency speed command while internally switching or filtering power differently. For direct SSR power switching, verify the waveform at the pump terminals; a module's acceptable command frequency is not automatically approval for direct power PWM at that frequency.
At genuine continuous 100% duty there are no ongoing carrier on/off transitions. Frequency comparisons must therefore include partial-duty operation. Also, 10 kHz is still within the human audible range: it can change the sound, but does not guarantee silence. Noise alone does not establish winding temperature or efficiency.
Our AI.SSR25 has a maximum potential PWM frequency of 100 kHz. That potential maximum is distinct from the 10–20 kHz operating range we discuss here and is not a recommendation to command every load at 100 kHz.
| Carrier frequency | Operating application | Engineering consideration |
|---|---|---|
| Continuous DC / 100% duty | Full supply and full-flow operation | A high-side implementation must support continuous on-state operation; confirm its gate-bias topology. |
| Below 200 Hz | Not a preferred default for these high-current pump applications | Long current excursions and torque pulsation need specific validation; do not assume suitability because the pump turns. |
| 200–500 Hz | Validation-only candidate; not an automatic ECU starting setting | Can increase ripple and RMS winding heat. Confirm actual pressure, flow, current and temperature; ECU availability is not pump approval. |
| 1 kHz | Intermediate benchmark point; not a verified minimum | May reduce ripple relative to lower frequencies, but does not by itself establish acceptable peak current, heat or noise. |
| 4–5 kHz | Candidate within general brushed-motor guidance | Evaluate ripple and temperatures with a suitably fast power stage; this is not a pump-specific manufacturer setting. |
| 10 kHz | Higher-frequency validation candidate; not a proven ideal | Evaluate reduced ripple against switching, diode and driver losses. Validate at required flow and pressure; 10 kHz can still be audible. |
| 15–20 kHz | Extend higher-frequency validation if component limits allow | Potential ripple/acoustic benefits must outweigh additional power-stage losses and retain current and thermal margins. |
| 100 kHz | AI.SSR25 maximum potential capability | Not a universal operating recommendation or evidence of a particular total-heat figure. |
Sources and evidence
- TI Automotive F90000285 pump performance sheet — no carrier-frequency minimum or optimum specified
- TI Automotive F90000295 pump performance sheet — no carrier-frequency minimum or optimum specified
- Microchip AN905: Brushed DC Motor Fundamentals — general 4–20 kHz guidance, not Walbro-specific validation
- ROHM: Brushed DC motor PWM losses — current-ripple and switching-loss trade-offs
4. SSR architecture: switching heat and inductive flyback
Decision matrix
Controller support for fuel-pump PWM
Compare documented frequency support first, then check each device against the load and installation limits.
- YESstated capability within applicable limits
- NOdocumented limit rules out the range
- NOT VERIFIEDexact-model evidence unavailable
- NOT SPECIFIEDnot stated in the cited datasheet
On small screens, scroll sideways to compare all three controllers.
| Feature / selection check | AI.SSR25 | Crydom D06D100 | i-Autoc KSJ30D100-L |
|---|---|---|---|
| PWM at 1 kHz and above | YES — stated capability, within limits | NO — published maximum 700 Hz | NOT SPECIFIED — no PWM frequency rating |
| PWM in the 10–20 kHz range | YES — within stated controller potential | NO — outside published PWM range | NOT SPECIFIED — no PWM frequency rating |
| Maximum PWM frequency | 100 kHz maximum potential | 700 Hz; resistive-load conditions apply | NOT SPECIFIED in cited datasheet |
| Continuous-current rating | 25 A; installation conditions apply | 100 A; heatsinking and derating required | 100 A maximum; apply heatsink/ambient derating |
| Rise / fall transition time | 35 ns / 40 ns; our transition example | NOT SPECIFIED as separate transition times | NOT SPECIFIED as separate transition times |
| Switching-only loss at 1 kHz | 0.012 W calculated | Outside published PWM range; not calculated | NOT VERIFIED |
| Switching-only loss at 15 kHz | 0.174 W calculated | Outside published PWM range; not calculated | NOT VERIFIED |
| Latched overcurrent threshold | 33 A; protection, not operating capacity | NOT SPECIFIED in cited datasheet | NOT SPECIFIED — surge rating is not a trip threshold |
| Electronic protection response | Below 4 µs; our analog eFuse specification | NOT SPECIFIED in cited datasheet | NOT SPECIFIED in cited datasheet |
| Inductive flyback suppression | YES — onboard 30 A Schottky freewheel path | External diode suppression required | External fast-recovery flywheel diode required |
| Fault indication | YES — latched red diagnostic LED | NOT SPECIFIED in cited datasheet | NOT SPECIFIED — LED listed, no fault function specified |
| Electrical connections | Deutsch DTP 4-pin interface | Screw terminals; verify exact variant | Screw terminals; input/output torque specified |
| Thermal mounting | CNC aluminium base/heatsink; follow installation limits | External heatsink required; follow derating curves | External heatsink + thermal interface; follow derating curves |
| Pump allocation / suitability | 1 × SSR25 per pump; calculate peak current | Pump application requires separate assessment | Pump application requires separate assessment; PWM limit unspecified |
Crydom manufacturer reference: Sensata/Crydom D06D Series datasheet (PDF)
i-Autoc manufacturer reference: KSJ Series Rev.4.0 — KSJ30D100-L (PDF)
A continuous-current label does not establish an SSR's suitability for high-frequency motor PWM. We consider industrial DC solid-state relays such as the Crydom D06D100 and i-Autoc KSJ30D100-L against their own switching-time, inductive-load and thermal specifications—not an advertised current rating alone.
We calculate MOSFET conduction and switching loss using the simplified model below. It is not a complete measurement of module heat: freewheel-diode, gate-driver and other circuit losses must also be considered.
Switching loss occurs during transitions when voltage across the power switch and current through it overlap. Turn-on and turn-off specifications can include control and propagation delays; they are not automatically the voltage/current rise and fall times required by our loss equation. A long command delay alone does not establish how much switching heat a relay produces.
Slow-transition illustration: at 14.5 V and 21.3 A, assuming a combined rise-and-fall time of 150–180 µs gives approximately 5.79–6.95 W of switching-only loss at 250 Hz. With our 35 ns / 40 ns transition example, the same model gives approximately 0.0029 W at 250 Hz. This demonstrates the effect of transition time under matched assumptions; it is not a measured comparison or a verified transition-time specification for either named industrial relay.
Fast switching reduces, but does not eliminate, switching loss. At 14.5 V and 21.3 A, with a 35 ns rise time and 40 ns fall time, we calculate approximately 0.012 W at 1 kHz and 0.174 W at 15 kHz. These are switching-only estimates, not total module heat.
A 1.18 W total-heat figure at 15 kHz requires defined supporting test conditions, including conduction, freewheel-diode and driver losses, operating temperature and mounting. We do not present that figure as a verified measurement or a fixed value across all loads, duties or frequencies.
For a fair device comparison, we separate published specifications, assumed calculation inputs and measured results. We would need matched load voltage, current, frequency, duty cycle, temperature and mounting, plus relevant switching waveforms, to substantiate a numerical total-heat advantage. We do not extend a relay's loss model beyond its permitted frequency or load conditions.
How we use the selection matrix: first check the required PWM frequency, then calculate each pump's peak current draw and check continuous, transient and thermal limits. YES indicates stated controller capability within the applicable limits—not approval for every pump or ECU, a pump-specific minimum, or an optimum frequency. NO indicates a documented frequency limit that rules out that operating range. NOT VERIFIED means we lack the exact-model evidence and must not assume either support or failure. The controller's switching-only estimates do not establish whether a Walbro pump runs hotter at 200–500 Hz than at 1 kHz or 10 kHz.
For an application needing 1 kHz or higher PWM, the Crydom D06D100 is outside its published 700 Hz maximum. Our AI.SSR25 has stated higher-frequency capability, but requires one controller per pump and an individual peak-current suitability check. The i-Autoc KSJ30D100-L datasheet does not specify a PWM frequency rating. Its maximum turn-on and turn-off times are each 0.3 ms at the stated 25°C conditions; these are not separately specified rise/fall transition times and do not establish an approved maximum carrier frequency. We therefore do not mark 1 kHz or 10–20 kHz support as either YES or NO from this timing alone.
Timing and heat notes: overall turn-on/off times must not be substituted for rise/fall transition times. The SSR25's 35 ns / 40 ns values are our stated transition example, and its watt figures are calculated switching-only estimates at 14.5 V and 21.3 A. They exclude conduction, diode and driver heat and are not measured competitor benchmarks. NOT SPECIFIED means a feature or operating limit is not stated in the cited manufacturer's datasheet, not proof that every product revision lacks it.
Crydom manufacturer reference: Sensata/Crydom D06D Series, fourth-generation datasheet, input/output specifications and General Note 5. The D06D100's 700 Hz PWM rating applies to resistive loads with at least 8 VDC control voltage; at maximum frequency, output current must be reduced to 75% of its rating. Inductive loads require diode suppression. Datasheet: https://www.mouser.com/datasheet/2/657/d06d-series-dc-panel-mount-1371031.pdf
i-Autoc manufacturer reference: KSJ Series, Rev.4.0 dated 27 July 2022, pages 1–3 and General Notes on page 7. We use the listed KSJ30D100-L variant; confirm the actual relay marking and revision rather than assuming an unsuffixed or customised unit is identical. Its output specifications at 25°C list a 0–24 VDC load range, 100 A maximum load current, 250 A peak surge at 10 ms, and 2.1 mΩ maximum on-state resistance. The control input is 4–32 VDC. The 100 A label requires the thermal derating curves and appropriate heatsink mounting with thermal grease or a pad; it is not a bare-module current guarantee. The 250 A surge rating is a withstand specification, not an active overcurrent-trip threshold or approval for repetitive pump-start pulses.
The i-Autoc datasheet specifies internal overvoltage protection, but still requires an external fast-recovery flywheel diode across an inductive load. Internal TVS protection is not the same as a motor-current recirculation path. The -L variant includes an LED indicator, but the datasheet does not describe it as a latched fault diagnostic or specify an electronic overcurrent-trip response. We retain those distinctions rather than equating an indicator or surge rating with our protection functions.
Inductive flyback: interrupting motor current requires a suitable recirculation or clamping path. We consider possible 80–120 V transients and use an onboard 30 A Schottky freewheel diode in our purpose-built controller. Actual transient voltage and diode loading depend on the circuit. Confirm internal protection or specify an appropriate external suppression network from the controller manufacturer's instructions.
P_conduction ≈ I_LOAD² × R_DS(on) × DP_switching ≈ 0.5 × V_BAT × I_LOAD × (t_r + t_f) × f_PWMP_module = conduction + switching + freewheel-diode + driver + other circuit losses5. Hydraulic calibration: minimum duty and fuel pressure
A fuel pump must deliver the required flow against regulator and rail pressure; it cannot safely be calibrated solely like a fan or an LED dimmer. Excessive duty reduction can cause inadequate pressure or flow, with consequences for both the engine and pump cooling.
We use an 11.0 V effective-supply target for our 40–60 psi base-pressure examples. This is an example calibration floor, not a proven universal stall voltage for all listed pumps. PWM behaviour is not identical to simply applying a lower DC voltage; verify pressure, flow and current across the operating envelope.
The illustrative duty calculation gives approximately 79.7% at 13.8 V and 75.9% at 14.5 V. Account for wiring and controller voltage drops and validate the actual system rather than relying on these percentages alone.
Illustrative minimum duty (%) = (11.0 V / actual supply voltage) × 100| Engine state | Effective-supply example | Duty example | Commissioning check |
|---|---|---|---|
| Key-on prime | Full supply, 13.8–14.5 V example | 100% | Build and verify required rail pressure before cranking. |
| Warm idle / light cruise | 11.0 V example target | Approximately 76–80% | Confirm stable pressure, sufficient flow and pump cooling; do not assume a universal stall threshold. |
| Moderate load / part boost | 12.5 V example target | Approximately 85–90% | Increase delivery ahead of injector demand and validate pressure under load. |
| Full boost / wide-open throttle | Full available supply | 100% | Verify flow at the actual maximum rail pressure, including boost reference and wiring losses. |
6. Prime strategy, wiring and circuit protection
- Pre-crank prime: we recommend a 2–3 second, 100% duty example to build rail pressure. Configure prime duration and pressure targets for the actual fuel system and ECU.
- High-side switching: our AI.SSR25 switches the positive supply. Follow our wiring diagram and provide a correctly sized return path; do not treat high-side switching alone as a guarantee against corrosion or every harness fault.
- Logic reference: Pin 4 is GND REF for the ECU ground reference. Verify the exact controller pinout and ECU ground instructions; do not connect motor return current through an ECU sensor-ground circuit.
- Sealed connections: we specify TE Connectivity Deutsch DTP 4-pin connectors with Size 12 contacts. Verify connector/contact ratings, wire size, sealing and mounting for the installation.
- Protection: we specify an autonomous analog eFuse with a response below 4 µs. Electronic protection does not remove the need to follow our upstream fuse and wiring requirements.
7. Aftermarket Industries AI.SSR25 solid-state controller
Our AI.SSR25 is a purpose-built high-side solid-state controller for suitable motorsport pumps and fans, with 25 A continuous capability and a 33 A latched protection threshold. Apply these specifications within our operating and installation conditions; a protection threshold is not a continuous-current rating.
- High-speed gate drive: we use a dedicated 4 A driver, with 35 ns / 40 ns transitions in our switching-loss examples. Maximum potential PWM frequency is 100 kHz; load-specific operating frequency remains a separate decision.
- Thermal performance: fast switching reduces dynamic loss, but total heat depends on current, duty, frequency, temperature, diode losses and cooling. A <1.2 W total-heat figure requires defined supporting test conditions and is not a universal rating.
- Flyback control: we use an onboard 30 A Schottky freewheel path and a 2 oz copper plane. Confirm the application limits and external suppression requirements in our installation documentation.
- Analog eFuse: we specify sub-4 µs protection with a latched red diagnostic LED for the specified overcurrent or fault conditions. Verify reset behaviour and fault coverage before commissioning.
- Static DC and PWM: we use a charge-pump path for continuous 100% on-state operation as well as ECU PWM control. Verify electrical compatibility before replacing a mechanical relay; connector and pinout differences still matter.
- Packaging: we specify a CNC 6061-T6 aluminium base/heatsink, an FKM perimeter gasket and TE Connectivity Deutsch DTP 4-pin interfaces.
8. Pump-frequency benchmarking and commissioning
A useful benchmark compares the complete pump system, not just relay switching loss. We have not published measured Walbro 460/525/535 frequency-versus-temperature results here. The process below defines the evidence needed before calling a frequency a preferred minimum or ideal. Live-fuel testing belongs in a properly equipped, fuel-safe facility with qualified personnel; do not run a pump dry or bypass its safety interlocks.
Record a continuous-DC reference for context, but do not compare its full-flow temperature directly with a lower-flow PWM point and call that an efficiency result. For each PWM comparison, keep delivered flow and pump pressure rise matched and adjust duty as necessary. Full-flow DC and partial-flow PWM are different hydraulic operating points.
- Identify the exact pump part number and motor architecture. Record fuel composition, supply voltage at the controller, inlet fuel temperature, tank level, plumbing, pressure, flow target, wiring and controller mounting/cooling. Hold these conditions consistent between comparable runs.
- Define permitted test points using the component manufacturers' limits and an approved validation plan. Candidate comparison points include 200/250/500 Hz, 1 kHz, 5 kHz and 10/15/20 kHz, but include only points allowed for the hardware. Never operate a comparison relay above its published frequency or load limits.
- At each frequency, adjust duty to achieve the same target flow and pressure, then repeat at relevant low-load and high-pressure operating points. Equal duty cycle does not necessarily produce equal hydraulic performance at different frequencies.
- Measure motor-current waveforms with suitable bandwidth and record average current, RMS current, peak-to-peak ripple, running peaks and startup/inrush peaks. Battery-side average current is not motor RMS current: the freewheel loop carries current during the off interval. Use appropriate isolated/differential voltage instrumentation and document probe bandwidth and sampling.
- Measure average battery-side input power from voltage and current, plus delivered flow and pump pressure rise. Hydraulic power is flow × pressure rise in consistent SI units. Input power minus hydraulic power represents combined pump/controller losses, not motor winding heat alone. Meter and plumbing losses must be accounted for in the measurement boundary.
- Log controller temperature, pump case temperature and inlet/return fuel temperatures until the defined steady-state condition is met, or report a matched timed interval. Case and fuel temperatures are not direct winding-temperature measurements. Stop before exceeding documented current, pressure or thermal limits, or if pressure/flow becomes unsafe or protection trips.
- Repeat each point at least three times with comparable starting temperatures, varying test order to reveal thermal carry-over. Report repeat variation and the limits of the instrumentation. Do not generalise one sample's result to every pump sold under the same flow name.
- Use one AI.SSR25 per pump. Calculate each pump's peak current draw and verify startup/inrush, continuous/transient and thermal suitability. A 33 A latched protection threshold is not operating-current headroom.
- Confirm the actual power-carrier waveform and ECU output's electrical interface, voltage limits and polarity. Treat 100 kHz as maximum potential capability, not a default setting. Check motor-rated channel suitability, derating and genuine continuous 100% duty.
- Verify inductive recirculation/clamping and diode dissipation from the manufacturer's instructions.
- Validate minimum duty using measured pressure, flow and current—not a universal assumed stall voltage. Configure and verify prime, engine-stall shutdown, ignition-off and command-loss behaviour, and verify pinout, wiring, fusing and connectors before commissioning.
- Publish measured results separately from datasheet ratings and calculated switching-only estimates. Include pump/controller model, test conditions, frequency, duty, flow, pressure, motor RMS/peak current, input power and temperatures. Select a setting only when performance, peak current and thermal margins are acceptable across the intended operating range.
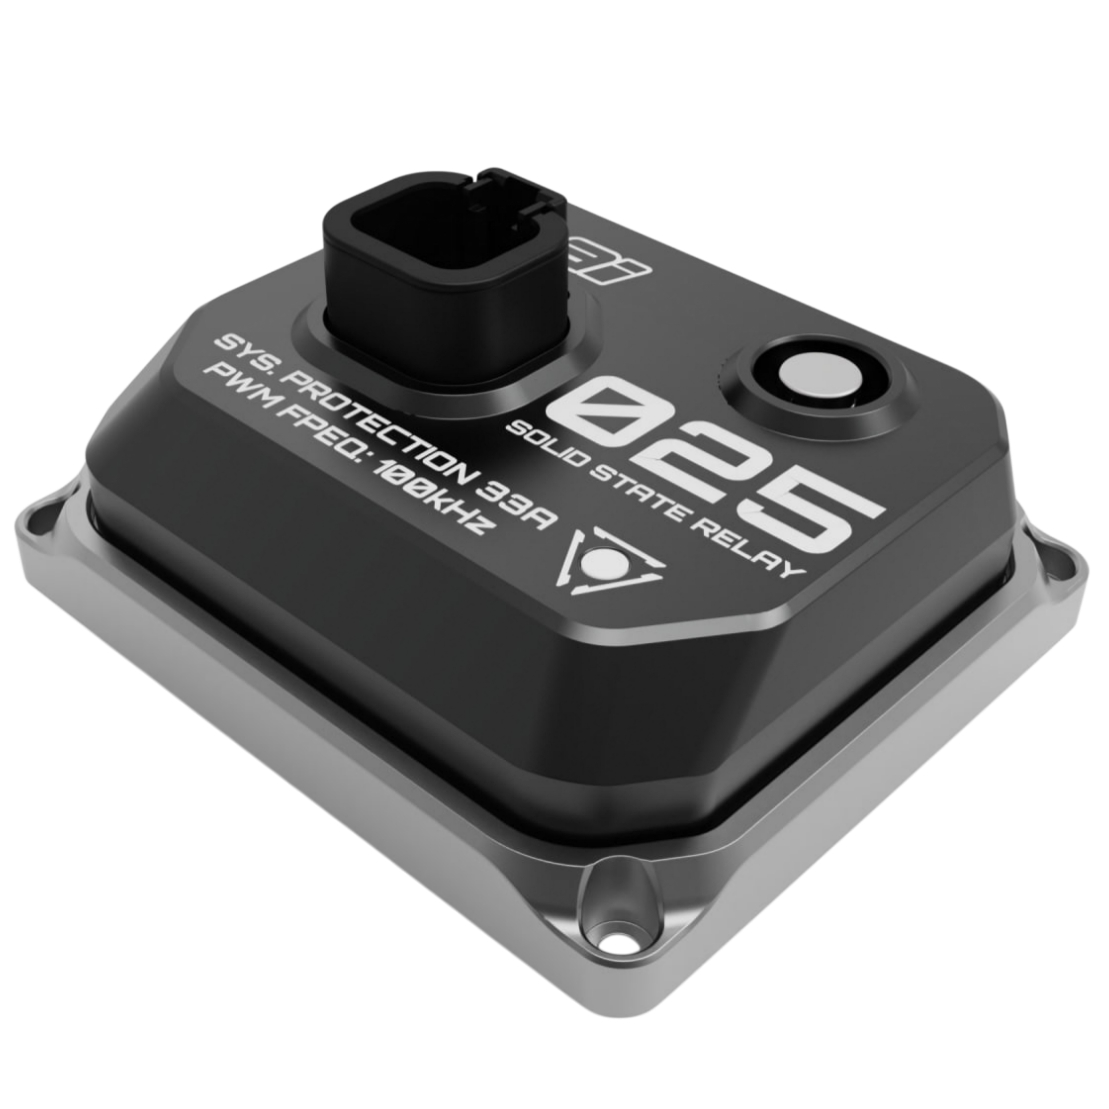
Component reference
SSR25 PWM solid-state relay
Check our AI.SSR25 specifications and installation instructions for your application, including current ratings, wiring and thermal requirements.
Open product informationFrequently asked questions
Can a mechanical fuel pump relay control pump speed with PWM?
A conventional mechanical relay is intended for on/off switching, not rapid PWM speed control. For PWM, select a motor-rated solid-state controller or a PDM output that explicitly supports the required load and frequency.
What is the difference between an SSR and a PDM?
An SSR is a semiconductor switching device or module, commonly for one load. A PDM generally distributes and protects power across multiple channels and may add monitoring or control. The AI.SSR25 is a single solid-state controller, not a complete multi-channel PDM.
What PWM frequency should I use for a fuel pump?
Use the pump manufacturer's specific recommendation when available and stay within the pump, controller and ECU limits. For Walbro 460/525/535 pumps, we do not have evidence establishing 1 kHz as a minimum or 10 kHz as an ideal. General brushed-motor guidance makes 10–20 kHz a useful range to evaluate with compatible hardware, while 1 kHz is an intermediate test point—not proof of suitability. We do not assume 200–500 Hz is safe because an ECU supports it. Compare measured RMS/peak motor current, flow, pressure, system power and temperatures at matched hydraulic performance before selecting a setting.
Does the AI.SSR25's 100 kHz potential mean every pump should run at 100 kHz?
No. The 100 kHz figure is the controller's maximum potential capability. Appropriate operating frequency depends on the motor, ECU, wiring and thermal conditions. Switching loss increases with frequency in the simplified model.
Is an 11 V minimum supply a universal fuel-pump stall limit?
No. We use 11 V as an example calibration target. The actual minimum duty must maintain required pressure and flow for the particular pump, fuel, supply voltage and pressure conditions.
Which output should I use on a Haltech, Link, MoTeC, Emtron, Syvecs or MaxxECU?
We select a spare output that the exact ECU model, firmware and software documentation permits for the required PWM function. Check that specific channel's frequency range, sink/source capability, voltage limits, polarity and any shared-function restrictions. Configure the fuel-pump function or documented equivalent with its safety interlocks. A brand name alone does not establish compatibility, and an ECU command output must not carry the pump's power current.
Can a low-side ECU output control a high-side solid-state relay?
It can, provided the controller's command input is electrically compatible. High-side describes how we switch power to the load; it does not by itself define the command-input polarity. A low-side ECU output sinks current rather than supplying a high signal. Match the controller's input requirements, ECU current/voltage limits and ground-reference instructions, and use the documented interface circuit where required. Do not connect the ECU command pin to the pump-power terminal.
When does an ECU PWM output need a pull-up resistor or interface circuit?
An open-drain or open-collector output can pull a signal low but may need a pull-up to establish the high level, unless the receiving controller already provides one. We check both manufacturers' input/output documentation before adding a resistor or interface. The pull-up voltage and resistance must respect the ECU's limits and the controller's input thresholds and current requirements. Do not assume a 12 V pull-up is safe, add one blindly or apply pump-supply voltage to a logic input.
How do I check whether the ECU's displayed PWM duty is inverted?
Check whether the ECU reports time high, time low or active-command duty, and whether the controller expects an active-high or active-low signal. We verify the control waveform and the corresponding load response using the documented output-test procedure before running the engine. An indicated 80% command is not automatically an 80% power-switch on-time. Confirm off, intermediate duty and full-on behaviour safely; never run the pump dry or assume a missing command means off.
What if my aftermarket ECU cannot generate 10–20 kHz PWM?
We use an operating frequency supported by the selected ECU channel, controller and motor together. If there is no suitable overlap, select a documented compatible output or control interface rather than forcing an unsupported setting. Distinguish an intelligent module's low-frequency speed command from direct motor power PWM. Validate pressure, flow, motor RMS/peak current, temperature and noise at the intended frequency. The AI.SSR25's 100 kHz maximum potential capability does not increase an ECU output's frequency limit, and availability of 200–500 Hz alone does not prove it is suitable for your pump.
How should I configure prime, minimum duty and fuel delivery under boost?
We establish required rail pressure before cranking, then validate minimum duty against measured pressure, flow and current. Our 2–3 second, 100% prime and 11 V effective-supply examples are starting examples, not universal settings. Increase delivery ahead of fuel demand and check transient response as load and boost rise; RPM alone does not describe fuel demand. For a 1:1 boost-referenced regulator, 45 psi base pressure plus 20 psi boost calls for approximately 65 psi rail gauge pressure. Confirm the actual regulator arrangement, injector differential pressure and pump flow at that pressure, with appropriate ECU low-pressure protection.
What should the pump do if the engine stops or the ECU loses power?
We retain the ECU's documented fuel-pump safety logic, including timed prime, cranking/running conditions and shutdown when the engine stops. Do not leave a generic PWM auxiliary output permanently enabled in place of these interlocks. Verify engine-stall shutdown, ignition-off behaviour and loss of the command signal for the actual controller and wiring. Some inputs can float or have a different default state when disconnected, so we do not assume loss of ECU power automatically switches the pump off.
Can one AI.SSR25 control two fuel pumps?
No. We specify one AI.SSR25 per fuel pump: two pumps require two controllers. Calculate each pump's peak current draw to determine suitability, using the pump manufacturer's current data for the actual supply voltage and fuel pressure and accounting for startup/inrush and worst-case operating conditions. Compare the result with the controller's applicable continuous and transient current limits, thermal limits and installation requirements. Nominal or idle current alone is not enough. The 25 A continuous capability is subject to installation conditions; the 33 A latched protection threshold is not extra continuous-current capacity. Size each pump's wiring, connectors and fusing accordingly.
Reader ratings are not enabled for this article.
Published by Aftermarket Industries Engineering · 2026-10-11